Military Recruitment 2010
June 30, 2011 - Notes and Sources
After the worst recession since the Great Depression, unemployment in the United States remains high. Army recruiters have credited the weak economy with a rise in recruitment numbers for years. Not only did the Army meet its recruitment goals for Fiscal Year 2012, in its analysis of FY2010 accessions to the U.S. Army, National Priorities Project (NPP) finds great gains in terms of recruit quality, particularly with respect to the educational attainment of recruits.
The Army reported a goal for FY2010 of 74,500 active Army recruits and maintained that goal throughout the year. In October 2010, they said that the goal was met with 74,577 recruits.1 Why do given Army numbers differ from those analyzed by NPP? First, the Army reports numbers of “contracts” rather than “accessions;” that is, the Army provides the number of recruits who signed a contract agreeing to join, while NPP looks at the number of recruits who arrive at boot camp or “accede.” Second, the data in this report is non-prior service recruits only, which is defined as a recruit who has not served in the armed forces for more than 180 days previously. Third, the Army counts individuals who sign a contract agreeing to deploy later (known as the Delayed Entry Program or DEP) when they sign the contract, while NPP's data would capture these recruits when they report for basic training.
Recruit Demographics
Of the 70,026 recruits in FY2010, 1,111 came from U.S. Possessions and Territories, including the Federated States of Micronesia, Guam, Puerto Rico, the U.S. Virgin Islands, and foreign addresses, including military postal addresses. The vast majority of recruits come from the United States, 68,915 this year. For some parts of our analysis, we use zip-code level data from the U.S. Census Bureau to give us a better idea of recruits’ backgrounds. About 1 percent of recruits report zip codes that are inconsistent with their reported hometowns. When we use Census data, we therefore restrict our analysis to the 68,129 recruits for whom we have consistent data.
Military Recruitment Count by County
| Rank | State | County | No. FY 2010 Recruits |
|---|---|---|---|
| 1 | California | Los Angeles County | 1437 |
| 2 | Arizona | Maricopa County | 1043 |
| 3 | Texas | Harris County | 907 |
| 4 | California | San Diego County | 719 |
| 5 | Texas | Bexar County | 676 |
| 6 | California | San Bernardino County | 653 |
| 7 | Illinois | Cook County | 649 |
| 8 | California | Riverside County | 623 |
| 9 | California | Orange County | 535 |
| 10 | Texas | Dallas County | 522 |
| 11 | Texas | Tarrant County | 492 |
| 12 | Florida | Miami-Dade County | 489 |
| 13 | Nevada | Clark County | 461 |
| 14 | Florida | Broward County | 427 |
| 15 | Florida | Hillsborough County | 416 |
| 16 | California | Sacramento County | 408 |
| 17 | Florida | Orange County | 392 |
| 18 | North Carolina | Cumberland County | 377 |
| 19 | Texas | El Paso County | 306 |
| 20 | Washington | Pierce County | 305 |
| 21 | New York | Kings County | 291 |
| 22 | Arizona | Pima County | 288 |
| 23 | Colorado | El Paso County | 287 |
| 24 | Florida | Duval County | 287 |
| 25 | Florida | Pinellas County | 253 |
| 26 | Texas | Bell County | 250 |
| 27 | California | Santa Clara County | 245 |
| 28 | Michigan | Wayne County | 245 |
| 29 | Hawaii | Honolulu County | 239 |
| 30 | Washington | King County | 239 |
| 31 | New York | Queens County | 238 |
| 32 | South Carolina | Richland County | 237 |
| 33 | New York | Bronx County | 237 |
| 34 | Ohio | Franklin County | 234 |
| 35 | Florida | Palm Beach County | 226 |
| 36 | Florida | Brevard County | 217 |
| 37 | Texas | Travis County | 209 |
| 38 | Texas | Denton County | 205 |
| 39 | Georgia | Fulton County | 205 |
| 40 | California | Fresno County | 205 |
| 41 | North Carolina | Mecklenburg County | 204 |
| 42 | Florida | Volusia County | 202 |
| 43 | Massachusetts | Middlesex County | 201 |
| 44 | North Carolina | Wake County | 192 |
| 45 | Utah | Salt Lake County | 192 |
| 46 | California | San Joaquin County | 187 |
| 47 | California | Alameda County | 187 |
| 48 | California | Kern County | 185 |
| 49 | Michigan | Oakland County | 181 |
| 50 | Texas | Collin County | 179 |
| 51 | Florida | Lee County | 178 |
| 52 | Virginia | Fairfax County | 178 |
| 53 | Tennessee | Shelby County | 176 |
| 54 | Georgia | Gwinnett County | 173 |
| 55 | Pennsylvania | Allegheny County | 172 |
| 56 | Maryland | Prince George's County | 170 |
| 57 | New York | Suffolk County | 170 |
| 58 | Oklahoma | Oklahoma County | 169 |
| 59 | Georgia | Cobb County | 168 |
| 60 | Virginia | Virginia Beach city | 164 |
| 61 | Pennsylvania | Philadelphia County | 163 |
| 62 | Georgia | Muscogee County | 161 |
| 63 | Georgia | DeKalb County | 160 |
| 64 | New York | Erie County | 158 |
| 65 | Indiana | Clay County | 154 |
| 66 | Missouri | St. Louis County | 153 |
| 67 | Ohio | Cuyahoga County | 152 |
| 68 | Michigan | Macomb County | 151 |
| 69 | Alabama | Jefferson County | 150 |
| 70 | Florida | Polk County | 149 |
| 71 | Washington | Snohomish County | 149 |
| 72 | California | Contra Costa County | 149 |
| 73 | California | Stanislaus County | 147 |
| 74 | Wisconsin | Milwaukee County | 147 |
| 75 | Florida | Pasco County | 146 |
| 76 | Missouri | Jackson County | 146 |
| 77 | Ohio | Montgomery County | 145 |
| 78 | New Mexico | Bernalillo County | 145 |
| 79 | Texas | Cameron County | 144 |
| 80 | Texas | Montgomery County | 143 |
| 81 | California | Ventura County | 143 |
| 82 | Connecticut | New Haven County | 142 |
| 83 | Oklahoma | Tulsa County | 140 |
| 84 | North Carolina | Guilford County | 137 |
| 85 | Illinois | Lake County | 136 |
| 86 | Illinois | DuPage County | 136 |
| 87 | Washington | Clark County | 135 |
| 88 | Maryland | Montgomery County | 135 |
| 89 | Florida | Seminole County | 132 |
| 90 | Tennessee | Montgomery County | 131 |
| 91 | Nevada | Washoe County | 131 |
| 92 | Texas | Hidalgo County | 131 |
| 93 | Georgia | Richmond County | 130 |
| 94 | Oregon | Multnomah County | 128 |
| 95 | Alabama | Madison County | 124 |
| 96 | Texas | Williamson County | 124 |
| 97 | Alabama | Mobile County | 124 |
| 98 | Maryland | Anne Arundel County | 124 |
| 99 | Idaho | Ada County | 123 |
| 100 | Colorado | Jefferson County | 122 |
This year's recruit pool was slightly more male, younger, and more racially diverse than last year. Note that Hispanic is considered an ethnicity and not a race by both the U.S. Army and the Census Bureau. An individual may belong to both an ethnic and a racial group, which leads to overlap among those who identify as Hispanic and black, Asian, white, or Native.
Military Recruitment - Demographics by Year
| Year | Race | Ethnicity | Age (yrs) | Sex | |||||||
|---|---|---|---|---|---|---|---|---|---|---|---|
| Black | White | Asian/PI | Native | Other | Hispanic | Male | Female | ||||
| FY05 | 15.0% | 80.4% | 3.4% | 1.2% | 0.0% | 11.8% | |||||
| FY06 | 14.4% | 80.4% | 3.5% | 1.1% | 0.5% | 11.1% | |||||
| FY07 | 14.9% | 80.8% | 3.2% | 1.0% | 0.1% | 10.7% | 83.6% | 16.4% | |||
| FY08 | 16.6% | 79.2% | 3.3% | 1.0% | 0.0% | 10.9% | 21.7 | 83.8% | 16.2% | ||
| FY09 | 17.2% | 78.1% | 3.8% | 0.9% | 0.0% | 10.9% | 21.9 | 84.4% | 15.6% | ||
| FY10 | 18.9% | 75.6% | 4.8% | 0.8% | 0.0% | 11.9% | 21.6 | 85.8% | 14.2% | ||
Educational Attainment
Having a regular high school diploma is the single best predictor of successful completion of a first term of enlistment. Decades of research by the Department of Defense show that 80 percent of recruits with a high school diploma will complete their first term of enlistment while up to half of those with alternative credentials or no high school education will drop out.2 Therefore, the Army has set a goal of 90 percent of recruits with high school diplomas or better.
For the first year since NPP began tracking military recruitment statistics in 2004, the Army not only met this goal but surpassed it. 96.8 percent of accessions in FY2010 had a high school diploma or better.
However, recent research indicates that modern high school education is failing to prepare graduates for the military. According to a report released in December 2010 by The Education Trust entitled “Shut Out of the Military: Today's High School Education Doesn't Mean You're Ready for Today's Army,” 1 in 5 high school students failed to qualify for enlistment in the Army based on their Armed Forces Qualification Test score.3 Students of color were more likely to fail the test. For future recruit pools, DoD may need to reconsider the value placed on a high school diploma if educational standards do not produce enough recruits able to pass the Armed Forces Qualification Test.
Military Recruitment - Proportion of Tier 1 Recruits by State
| Rank in FY10 | State | FY07 | FY08 | FY09 | FY10 |
|---|---|---|---|---|---|
| - | All recruits | 70.7% | 73.4% | 84.9% | 96.8% |
| - | US recruits only | 70.4% | 73.8% | 84.8% | 96.8% |
| 44 | Alabama | 62.3% | 68.6% | 81.7% | 95.0% |
| 42 | Alaska | 65.3% | 65.1% | 71.4% | 95.3% |
| 15 | Arizona | 68.8% | 69.4% | 83.9% | 97.1% |
| 31 | Arkansas | 59.9% | 63.7% | 79.3% | 96.4% |
| 7 | California | 73.3% | 75.6% | 86.5% | 97.6% |
| 39 | Colorado | 69.3% | 69.6% | 82.4% | 95.5% |
| 3 | Connecticut | 78.6% | 82.5% | 91.0% | 98.3% |
| 35 | Delaware | 76.3% | 81.5% | 90.8% | 96.1% |
| 38 | District of Columbia | 79.5% | 67.5% | 93.2% | 95.7% |
| 10 | Florida | 66.1% | 69.0% | 82.7% | 97.3% |
| 27 | Georgia | 64.6% | 69.1% | 82.1% | 96.6% |
| 4 | Hawaii | 78.3% | 79.6% | 87.6% | 98.2% |
| 48 | Idaho | 64.8% | 67.5% | 80.3% | 93.9% |
| 24 | Illinois | 72.6% | 77.1% | 85.8% | 96.8% |
| 33 | Indiana | 64.8% | 67.9% | 78.7% | 96.3% |
| 12 | Iowa | 77.8% | 79.4% | 87.9% | 97.3% |
| 34 | Kansas | 72.8% | 73.6% | 84.1% | 96.2% |
| 40 | Kentucky | 71.8% | 73.2% | 84.3% | 95.4% |
| 8 | Louisiana | 64.6% | 68.7% | 82.0% | 97.5% |
| 17 | Maine | 71.9% | 72.4% | 85.0% | 97.1% |
| 29 | Maryland | 69.4% | 77.6% | 85.4% | 96.5% |
| 13 | Massachusetts | 76.8% | 77.2% | 88.2% | 97.2% |
| 6 | Michigan | 69.3% | 73.0% | 85.0% | 97.6% |
| 2 | Minnesota | 79.8% | 81.7% | 89.7% | 98.4% |
| 36 | Mississippi | 59.2% | 64.2% | 80.7% | 95.8% |
| 26 | Missouri | 73.7% | 75.0% | 84.7% | 96.7% |
| 51 | Montana | 58.2% | 65.4% | 76.5% | 92.6% |
| 19 | Nebraska | 80.6% | 82.1% | 92.9% | 97.0% |
| 41 | Nevada | 54.1% | 59.7% | 80.7% | 95.4% |
| 22 | New Hampshire | 75.4% | 70.6% | 86.3% | 96.9% |
| 1 | New Jersey | 78.3% | 80.4% | 87.8% | 98.6% |
| 28 | New Mexico | 72.6% | 72.3% | 81.8% | 96.6% |
| 18 | New York | 67.7% | 73.6% | 85.5% | 97.1% |
| 16 | North Carolina | 76.6% | 79.0% | 88.1% | 97.1% |
| 11 | North Dakota | 66.7% | 71.4% | 90.8% | 97.3% |
| 9 | Ohio | 74.9% | 78.2% | 87.9% | 97.4% |
| 47 | Oklahoma | 65.8% | 70.8% | 79.5% | 94.6% |
| 45 | Oregon | 62.3% | 65.6% | 78.7% | 95.0% |
| 23 | Pennsylvania | 75.2% | 76.5% | 86.1% | 96.9% |
| 37 | Rhode Island | 63.8% | 62.3% | 78.2% | 95.7% |
| 5 | South Carolina | 70.4% | 73.2% | 84.9% | 97.7% |
| 49 | South Dakota | 75.4% | 81.5% | 86.5% | 93.7% |
| 20 | Tennessee | 65.1% | 70.6% | 84.1% | 97.0% |
| 25 | Texas | 75.0% | 77.7% | 87.3% | 96.8% |
| 30 | Utah | 62.6% | 69.2% | 83.5% | 96.5% |
| 21 | Vermont | 80.8% | 81.9% | 94.3% | 97.0% |
| 32 | Virginia | 66.9% | 71.8% | 84.9% | 96.4% |
| 43 | Washington | 65.1% | 67.8% | 79.0% | 95.1% |
| 46 | West Virginia | 66.5% | 69.0% | 78.3% | 95.0% |
| 14 | Wisconsin | 77.7% | 81.2% | 90.0% | 97.1% |
| 50 | Wyoming | 66.9% | 59.3% | 83.3% | 93.5% |
Armed Forces Qualification Test
Each recruit is scored on a scale of 0-99 when they take the Armed Forces Qualification Test (AFQT) before beginning duty. This score is a percentile instead of an absolute and indicates where the recruit scored compared to 18-23 year old civilians who took the test in 1997 as part of a norming study.
The Army uses the AFQT percentile scores as an indication of recruit trainability. Recruits with scores in Test Score Categories (TSC) I (AFQT percentiles 93-99) and II (65-92) are considered to be above average in trainability; those with scores in TSCs IIIA (50-64) and IIIB (31-49) are considered of average trainability; those with scores in Category IV (10-30) are considered of below average trainability; and those with scores in Category V (0-9) are considered of markedly below average trainability and are typically refused enlistment.
In previous years, the Department of Defense supplied NPP with the actual score of each recruit. For FY2010, they created three categories of scores and assigned one to each recruit (scores of 99-50, 49-31, and 30 or less). For the last category, NPP assumes this is solely Category IV recruits (with scores of 10-30) due to both the low incidence of these scores and the policy of barring those with AFQT percentiles of less than 10 from joining.
Until 2006, DoD's goal was a minimum of 67 percent of recruits testing at least in the 50th percentile of the AFQT, with scores falling into TSCs I – IIIA (99-50) and indicating average to above average trainability. That goal has since been lowered to 60 percent of recruits in these categories. The Army met their current standard with 63.9 percent of recruits scoring in TSC I-IIIA in FY2010, although this represents a decrease from the FY2009 rate of 66.4 percent.
At the other end of the scoring spectrum, DoD set the goal of 4 percent or less of recruits scoring in categories IV (10-30). FY2010 not only continued the trend of meeting this goal, but low-scoring recruits were almost non-existent. A mere 273 recruits out of 70,026 (or 0.38 percent) scored in this range.
Military Recruitment - Proportion of Test Score Categories I-IIIA and IV by State
| State | FY08 | FY09 | FY10 | |||
|---|---|---|---|---|---|---|
| TSC I-IIIA | TSC IV | TSC I-IIIA | TSC IV | TSC I-IIIA | TSC IV | |
| All recruits | 62.0% | 3.5% | 66.4% | 1.5% | 63.9% | 0.4% |
| US recruits only | 62.6% | 3.2% | 67.0% | 1.3% | 64.5% | 0.2% |
| Alabama | 60.3% | 2.4% | 62.9% | 1.3% | 55.5% | 0.0% |
| Alaska | 66.5% | 2.8% | 78.1% | 0.0% | 65.3% | 0.0% |
| Arizona | 66.1% | 2.6% | 69.6% | 1.2% | 69.3% | 0.3% |
| Arkansas | 62.3% | 3.5% | 61.5% | 1.5% | 57.4% | 0.0% |
| California | 61.1% | 4.5% | 63.9% | 2.0% | 63.8% | 0.5% |
| Colorado | 68.5% | 2.7% | 74.4% | 1.0% | 72.2% | 0.0% |
| Connecticut | 60.3% | 4.1% | 66.9% | 0.5% | 63.5% | 0.6% |
| Delaware | 70.5% | 1.4% | 64.9% | 3.1% | 64.8% | 0.0% |
| District of Columbia | 50.0% | 0.0% | 57.7% | 0.0% | 52.2% | 0.0% |
| Florida | 63.6% | 2.3% | 68.2% | 0.8% | 63.9% | 0.3% |
| Georgia | 58.4% | 2.3% | 62.7% | 1.3% | 58.0% | 0.2% |
| Hawaii | 46.9% | 9.6% | 55.1% | 5.2% | 55.4% | 0.0% |
| Idaho | 72.6% | 0.7% | 75.3% | 0.2% | 69.5% | 0.0% |
| Illinois | 61.5% | 3.7% | 66.4% | 1.4% | 66.0% | 0.1% |
| Indiana | 70.5% | 1.5% | 74.1% | 1.0% | 72.3% | 0.0% |
| Iowa | 63.9% | 3.9% | 75.4% | 0.9% | 69.3% | 0.4% |
| Kansas | 65.3% | 3.3% | 74.2% | 0.5% | 70.0% | 0.4% |
| Kentucky | 61.8% | 2.7% | 64.4% | 0.6% | 66.1% | 0.0% |
| Louisiana | 53.1% | 4.6% | 56.3% | 1.9% | 52.8% | 0.0% |
| Maine | 64.8% | 2.4% | 69.8% | 0.8% | 72.0% | 0.0% |
| Maryland | 61.1% | 3.0% | 63.4% | 1.0% | 62.7% | 0.3% |
| Massachusetts | 62.5% | 5.2% | 66.6% | 2.7% | 69.1% | 0.1% |
| Michigan | 62.1% | 4.1% | 69.8% | 0.9% | 66.4% | 0.3% |
| Minnesota | 71.8% | 2.7% | 72.1% | 1.5% | 75.3% | 0.0% |
| Mississippi | 53.8% | 4.8% | 55.4% | 1.2% | 50.4% | 0.0% |
| Missouri | 62.7% | 4.3% | 66.7% | 1.4% | 63.0% | 0.1% |
| Montana | 65.7% | 1.7% | 77.9% | 0.7% | 73.0% | 0.0% |
| Nebraska | 69.2% | 2.1% | 69.2% | 2.2% | 69.3% | 0.5% |
| Nevada | 63.6% | 2.6% | 69.7% | 1.1% | 66.2% | 0.0% |
| New Hampshire | 67.5% | 3.6% | 73.0% | 0.7% | 75.5% | 0.0% |
| New Jersey | 56.6% | 5.3% | 64.8% | 1.5% | 62.9% | 0.3% |
| New Mexico | 59.1% | 2.7% | 65.3% | 1.5% | 61.1% | 0.4% |
| New York | 60.8% | 3.8% | 67.2% | 1.5% | 65.9% | 0.4% |
| North Carolina | 61.7% | 2.9% | 63.6% | 1.2% | 60.9% | 0.2% |
| North Dakota | 80.4% | 1.8% | 72.4% | 1.1% | 79.7% | 0.0% |
| Ohio | 64.5% | 2.5% | 69.3% | 1.6% | 64.3% | 0.1% |
| Oklahoma | 60.3% | 4.0% | 63.9% | 1.3% | 65.0% | 0.0% |
| Oregon | 69.9% | 2.3% | 74.8% | 1.4% | 72.7% | 0.0% |
| Pennsylvania | 65.5% | 3.0% | 71.3% | 1.1% | 69.9% | 0.1% |
| Rhode Island | 64.9% | 2.0% | 65.3% | 2.7% | 74.3% | 0.0% |
| South Carolina | 56.2% | 3.9% | 61.9% | 0.7% | 56.8% | 0.0% |
| South Dakota | 64.8% | 5.6% | 68.9% | 2.0% | 67.5% | 0.0% |
| Tennessee | 63.2% | 2.3% | 68.2% | 0.6% | 64.8% | 0.0% |
| Texas | 61.8% | 3.3% | 64.6% | 1.4% | 62.6% | 0.3% |
| Utah | 66.2% | 1.8% | 72.2% | 1.8% | 74.0% | 0.0% |
| Vermont | 71.6% | 0.9% | 76.1% | 1.1% | 68.7% | 0.0% |
| Virginia | 61.2% | 2.9% | 67.8% | 1.6% | 62.7% | 0.1% |
| Washington | 69.7% | 1.4% | 74.3% | 0.8% | 72.1% | 0.1% |
| West Virginia | 57.1% | 3.1% | 65.7% | 0.3% | 62.2% | 0.0% |
| Wisconsin | 68.7% | 2.7% | 71.5% | 0.9% | 69.4% | 0.0% |
| Wyoming | 70.4% | 2.2% | 71.7% | 0.0% | 67.2% | 0.0% |
Note. TSC I-IIIA represents AFQT test scores ranging from 50-99, and the Army's goal is for at least 60% of its recruits to score in this range. TSC IV represents AFQT scores from 10-30, and the Army's goal is for 4% or less of its recruits to score in this range. The Army typically does not enlist those scoring below the 10th percentile on the AFQT.
High Quality Recruits
The Department of Defense defines a “high quality” recruit based on a combination of educational attainment and AFQT score. A “high quality” recruit is one who scores at or above the 50th percentile on the AFQT (Categories I – IIIA) and who is Tier 1 (has a regular high school diploma or better). DoD strives to have all recruits be “high quality” as these recruits will be more likely to complete contracted enlistment terms and perform better during training and in the service.
Military Recruitment - Proportion of High Quality Recruits
| State | FY07 | FY08 | FY09 | FY10 |
|---|---|---|---|---|
| All recruits | - | - | - | 61.4% |
| US recruits only | 44.9% | 45.9% | 54.1% | 61.9% |
| Alabama | 36.7% | 40.5% | 47.6% | 52.2% |
| Alaska | 46.0% | 44.2% | 52.8% | 60.6% |
| Arizona | 45.8% | 45.8% | 55.6% | 66.7% |
| Arkansas | 35.5% | 38.6% | 44.3% | 54.7% |
| California | 44.7% | 44.9% | 52.3% | 61.7% |
| Colorado | 51.8% | 48.2% | 59.0% | 68.3% |
| Connecticut | 51.4% | 50.0% | 59.2% | 62.4% |
| Delaware | 39.2% | 59.6% | 58.8% | 62.5% |
| District of Columbia | 46.2% | 30.0% | 51.9% | 50.0% |
| Florida | 41.5% | 43.8% | 53.3% | 61.6% |
| Georgia | 38.9% | 39.4% | 48.5% | 55.5% |
| Hawaii | 43.4% | 38.1% | 44.9% | 53.8% |
| Idaho | 47.6% | 50.0% | 58.5% | 65.6% |
| Illinois | 47.8% | 47.0% | 54.7% | 63.3% |
| Indiana | 46.2% | 48.7% | 55.8% | 69.0% |
| Iowa | 51.3% | 51.9% | 63.7% | 66.9% |
| Kansas | 49.4% | 48.8% | 60.1% | 66.9% |
| Kentucky | 45.0% | 45.5% | 52.0% | 61.8% |
| Louisiana | 33.3% | 36.6% | 42.7% | 50.7% |
| Maine | 50.3% | 46.1% | 57.1% | 69.8% |
| Maryland | 40.9% | 48.2% | 52.4% | 60.1% |
| Massachusetts | 51.1% | 48.8% | 56.6% | 67.0% |
| Michigan | 45.8% | 45.5% | 56.5% | 64.2% |
| Minnesota | 55.8% | 58.7% | 62.9% | 73.8% |
| Mississippi | 31.6% | 34.1% | 40.4% | 47.6% |
| Missouri | 45.5% | 46.4% | 53.3% | 60.7% |
| Montana | 41.2% | 46.5% | 58.0% | 68.0% |
| Nebraska | 51.6% | 57.5% | 62.7% | 66.6% |
| Nevada | 33.6% | 38.9% | 53.0% | 62.8% |
| New Hampshire | 55.2% | 46.4% | 61.9% | 73.5% |
| New Jersey | 45.2% | 45.7% | 54.5% | 61.8% |
| New Mexico | 41.5% | 41.9% | 50.8% | 58.5% |
| New York | 42.7% | 45.7% | 56.0% | 63.7% |
| North Carolina | 47.8% | 48.8% | 53.4% | 58.5% |
| North Dakota | 53.6% | 60.7% | 64.4% | 78.4% |
| Ohio | 51.2% | 51.3% | 59.1% | 62.1% |
| Oklahoma | 40.8% | 43.2% | 48.4% | 61.4% |
| Oregon | 43.6% | 46.4% | 55.7% | 68.8% |
| Pennsylvania | 50.2% | 50.0% | 59.4% | 67.3% |
| Rhode Island | 43.8% | 39.7% | 46.3% | 70.7% |
| South Carolina | 40.2% | 38.0% | 48.9% | 54.7% |
| South Dakota | 54.4% | 53.7% | 56.1% | 61.9% |
| Tennessee | 43.9% | 45.2% | 54.4% | 62.2% |
| Texas | 46.3% | 48.1% | 53.7% | 60.1% |
| Utah | 41.1% | 47.0% | 58.0% | 71.5% |
| Vermont | 53.4% | 61.2% | 70.5% | 65.7% |
| Virginia | 42.3% | 44.6% | 55.7% | 59.9% |
| Washington | 45.9% | 47.6% | 55.7% | 68.2% |
| West Virginia | 44.1% | 41.7% | 48.8% | 58.7% |
| Wisconsin | 52.1% | 56.0% | 62.4% | 66.7% |
| Wyoming | 48.2% | 40.7% | 58.7% | 61.8% |
Overall Recruitment Rates
The number of recruits from a given location is useful information, but it does not give a complete picture of recruitment. For example, in FY2010, Maine and Nebraska contributed almost the same number of recruits (411 and 437 respectively). However, Maine's much smaller population means they contributed a larger percentage of their youth to the military, and this is reflected in the recruitment rate of each state. Maine's rate, which is calculated as number of recruits per 1,000 youth aged 18-24, is 3.6, while Nebraska's is 2.4. In order to better illustrate the targeted demographic for enlistment, rates from NPP's previous years of analysis have been adjusted to reflect a candidate pool of 18-24 year old youths instead of the 15-24 standard used previously.
Military Recruitment - Regional Recruitment Rates
| FY06 | FY07 | FY08 | FY09 | FY10 | |
|---|---|---|---|---|---|
| Northeast | 1.61 | 1.54 | 1.56 | 1.44 | 1.50 |
| Midwest | 2.34 | 2.17 | 2.07 | 1.90 | 2.02 |
| South | 2.84 | 2.84 | 2.94 | 2.59 | 2.83 |
| West | 2.06 | 1.90 | 2.04 | 2.06 | 2.23 |
Military Recruitment - State Recruitment Rates
| Rank | State | FY07 | FY08 | FY09 | FY10 |
|---|---|---|---|---|---|
| - | US Recruits Total | 2.27 | 2.29 | 2.10 | 2.28 |
| 8 | Alabama | 3.59 | 3.61 | 3.20 | 3.15 |
| 24 | Alaska | 3.00 | 2.87 | 2.39 | 2.36 |
| 11 | Arizona | 2.71 | 3.30 | 2.94 | 2.94 |
| 20 | Arkansas | 3.29 | 2.80 | 2.43 | 2.58 |
| 35 | California | 1.53 | 1.59 | 1.64 | 1.92 |
| 16 | Colorado | 2.23 | 2.26 | 2.31 | 2.68 |
| 45 | Connecticut | 1.10 | 1.17 | 1.21 | 1.48 |
| 42 | Delaware | 1.17 | 1.73 | 1.56 | 1.52 |
| 51 | District of Columbia | 0.61 | 0.61 | 0.79 | 0.65 |
| 6 | Florida | 2.99 | 3.17 | 2.86 | 3.25 |
| 2 | Georgia | 2.93 | 3.36 | 3.00 | 3.45 |
| 14 | Hawaii | 2.46 | 2.14 | 2.20 | 2.71 |
| 9 | Idaho | 2.56 | 2.96 | 2.93 | 3.01 |
| 38 | Illinois | 1.89 | 1.71 | 1.54 | 1.70 |
| 29 | Indiana | 2.21 | 2.46 | 2.17 | 2.08 |
| 37 | Iowa | 1.96 | 1.94 | 1.74 | 1.79 |
| 26 | Kansas | 2.79 | 2.40 | 2.27 | 2.32 |
| 34 | Kentucky | 2.53 | 2.37 | 2.09 | 1.94 |
| 36 | Louisiana | 2.13 | 2.00 | 1.71 | 1.80 |
| 1 | Maine | 3.34 | 3.14 | 3.04 | 3.59 |
| 31 | Maryland | 1.67 | 1.73 | 1.67 | 2.04 |
| 47 | Massachusetts | 1.23 | 1.37 | 1.30 | 1.43 |
| 30 | Michigan | 2.29 | 2.17 | 1.99 | 2.05 |
| 44 | Minnesota | 1.29 | 1.43 | 1.43 | 1.51 |
| 33 | Mississippi | 1.90 | 2.24 | 1.99 | 1.97 |
| 15 | Missouri | 2.89 | 2.74 | 2.29 | 2.69 |
| 17 | Montana | 3.39 | 3.00 | 2.96 | 2.67 |
| 23 | Nebraska | 2.21 | 2.09 | 2.00 | 2.38 |
| 5 | Nevada | 3.04 | 3.47 | 3.16 | 3.42 |
| 22 | New Hampshire | 1.99 | 2.04 | 2.27 | 2.40 |
| 46 | New Jersey | 1.19 | 1.26 | 1.31 | 1.47 |
| 25 | New Mexico | 2.27 | 2.59 | 2.26 | 2.33 |
| 48 | New York | 1.57 | 1.51 | 1.34 | 1.31 |
| 7 | North Carolina | 3.04 | 3.07 | 2.83 | 3.17 |
| 50 | North Dakota | 0.91 | 0.73 | 1.14 | 0.93 |
| 27 | Ohio | 2.30 | 2.29 | 2.16 | 2.29 |
| 13 | Oklahoma | 3.31 | 2.74 | 2.40 | 2.76 |
| 19 | Oregon | 2.50 | 2.53 | 2.71 | 2.61 |
| 40 | Pennsylvania | 1.83 | 1.80 | 1.61 | 1.59 |
| 49 | Rhode Island | 1.43 | 1.36 | 1.34 | 1.26 |
| 3 | South Carolina | 3.03 | 3.20 | 2.80 | 3.45 |
| 43 | South Dakota | 1.67 | 1.97 | 1.80 | 1.51 |
| 18 | Tennessee | 2.43 | 2.66 | 2.56 | 2.63 |
| 12 | Texas | 3.21 | 3.30 | 2.69 | 2.81 |
| 41 | Utah | 1.04 | 1.56 | 1.73 | 1.53 |
| 39 | Vermont | 1.17 | 1.89 | 1.44 | 1.63 |
| 10 | Virginia | 2.61 | 2.79 | 2.64 | 2.97 |
| 21 | Washington | 2.06 | 2.23 | 2.39 | 2.45 |
| 28 | West Virginia | 2.81 | 2.79 | 2.09 | 2.10 |
| 32 | Wisconsin | 2.37 | 1.87 | 1.80 | 1.97 |
| 4 | Wyoming | 2.59 | 2.56 | 2.59 | 3.43 |
Metro/Non Metro
The U.S. Department of Agriculture distinguishes between metropolitan and non-metropolitan counties. We used their definitions to separate metropolitan and non-metropolitan recruits in Table 10. Recruitment rates are about 20 percent higher in non-metropolitan counties than they are in metropolitan counties. That said, the vast majority of young people live in metropolitan counties, and those counties provide 81 percent of the military’s total recruits. The breakdown changes across different races. Black, Asian, and Hispanic recruits are more likely to come from metropolitan counties than the average recruit, while Native recruits are much more likely to come from non-metropolitan counties than the average recruit.
Military Recruitment - Percentage Metro/Non Metro
| Recruitment Rate | Percentage of Recruits | Percentage of White Recruits | Percentage of Black Recruits | Percentage of Asian Recruits | Percentage of Native Recruits | |
|---|---|---|---|---|---|---|
| Metro counties | 2.2 | 81% | 79% | 85% | 93% | 57% |
| Non-Metro counties | 2.7 | 19% | 21% | 15% | 7% | 43% |
Recruit Zip Code Income
Unfortunately, the military offers no data on recruits' household incomes. However, we do know the median household income of each recruit’s zip code. Using this data we can explore whether recruits tend to come from poor, middle-class, or wealthy zip codes.
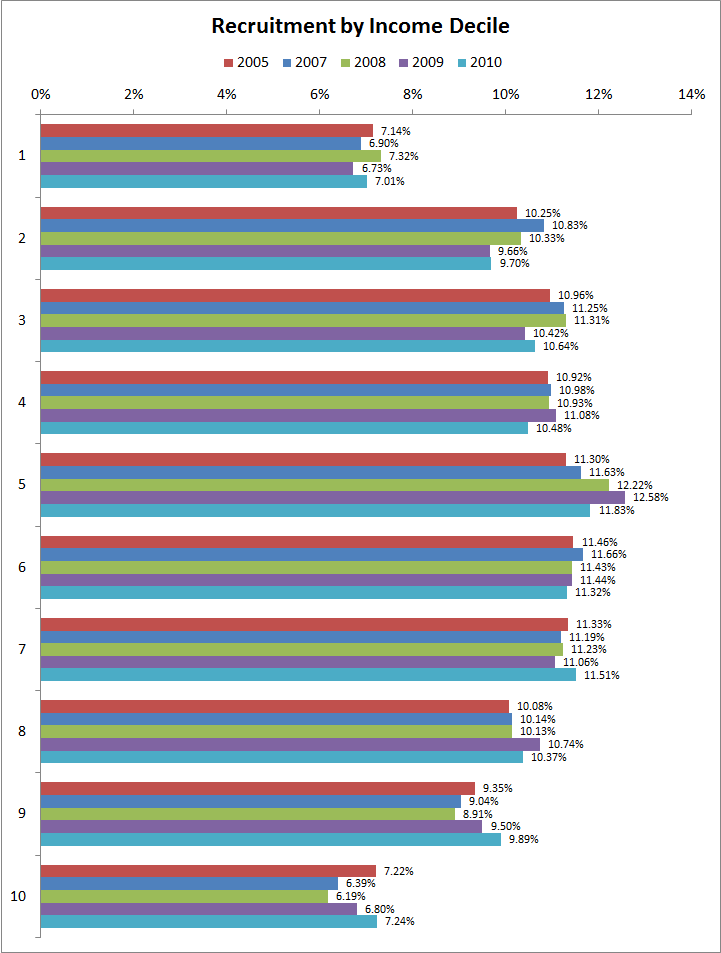
Figure 1 illustrates the likely economic background of military recruits for the years 2005, 2007, 2008, 2009, and 2010. Each decile on the vertical y-axis represents 10 percent of the youth population, 18-24 years old. The first decile represents the 10 percent coming from the poorest zip codes while the tenth decile represents the wealthiest zip codes. As in past years, youth from both the poorest and the wealthiest zip codes are underrepresented this year. For example, in 2010 only 7 percent of recruits came from the poorest zip codes, even though those zip codes contain 10 percent of the American youth population.
Economy and Recruiting Impact
Last year, NPP analyzed the correlation between unemployment rates and recruitment rates across counties and found very little; this pattern repeated again in FY2010. Although the data does not suggest a strong statistical connection between unemployment rates and recruitment rates, other factors lend support to recruiters' assertions that the poor economy is driving candidates to seek out the armed forces as a career choice.
In terms of sheer numbers, the 7,000 recruit jump in active Army accessions between FY2009 and FY2010 speaks to an increased desire to join the Army, but this information is more powerful in context. The Delayed Entry Program (DEP) is a program which allows recruits to sign a contract which guarantees them a specific military occupation specialty and requires them to arrive at basic training by a certain date. When FY2011 recruitment began in October of 2010, the Army had already fulfilled 50 percent of its recruiting goals for the entire year with recruits in the DEP.4 When the Army is able to fulfill not only the current fiscal year's demands but half of the next, it becomes more difficult for individuals to enlist and overall recruit quality rises as the services take their pick of the best qualified.
Another impact of the influx of candidates, and the ability of recruiters to choose from among them, is the rising education requirements. With the achievement of its Tier 1 goal of 90 percent or better, the Army decided in August of 2010 to discontinue its program to help enlistees earn their GED high school equivalency certificates as part of their training.5
In April 2011 the Army announced that it was lowering the maximum enlistment age from 42 back to 35 (it raised it to 42 in 2006).6 While this did not impact recruiting in FY2010, it is another reflection of the increase in numbers of better qualified recruits.
Not every recruit joined because they were unable to find a job in the civilian sector. What is known, however, is that in FY2010 there was an increase in the number of applications, and the applicants were better qualified than in the past.