Thanks, EPI, for adding some sense to the world
By
Mattea Kramer
Posted:
|
Transparency & Data
This week the Economic Policy Institute celebrates its 25th anniversary. We at National Priorities Project want to thank EPI for a quarter century of service, and for things like this chart, from the recent EPI report on income inequality:
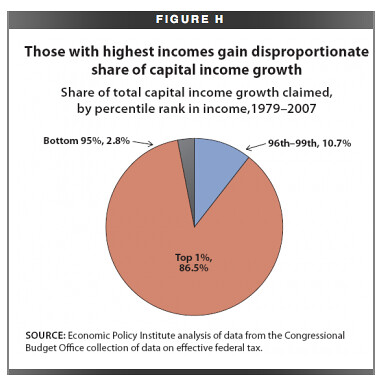
This chart is a unique- and telling- way of examining the kind of income inequality that motivates many involved in the Occupy movement. The bottom 95 percent of Americans claimed 2.8 percent of capital income growth between 1979 and 2007. What is capital income growth? "Capital income" is money earned from investments like stocks and real estate. Thus, as capital income grew over this 30-year period, just about all of that new income went to the wealthiest 5 percent of Americans, contributing to the steep inequality that the nonpartisan Congressional Budget Office found in its recent report.
Happy birthday, EPI!