President's 2015 Budget in Pictures
March 19, 2014 - Download PDF Version
By Jasmine Tucker
Chart assistance by Daniel Gautreau
Easily share any of the charts below by clicking on the social media buttons directly below them.
President Obama recently released his 2015 budget proposal. And budgets are about priorities: What we’re going to spend money on, and how we’re going to raise the money that we’re spending. These pictures tell the story of the priorities in the president’s budget.
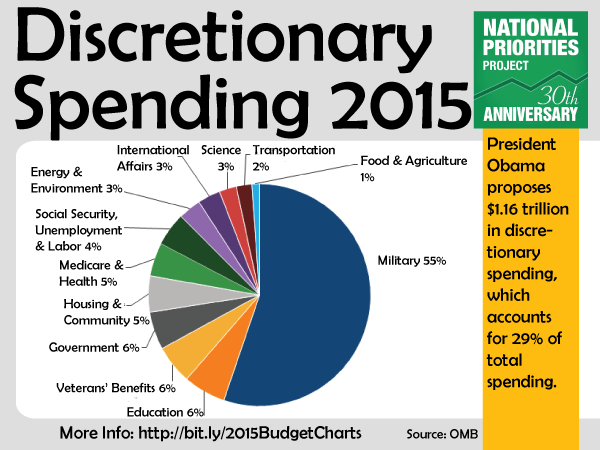
Discretionary Spending
This is how President Obama proposes allocating $1.16 trillion in discretionary spending in fiscal year 2015. Discretionary spending is the part of the federal budget that Congress determines annually during the federal budget process, and it accounts for 29 percent of total spending in the president's proposed 2015 budget. It does not include earned-benefit programs like Social Security and Medicare.
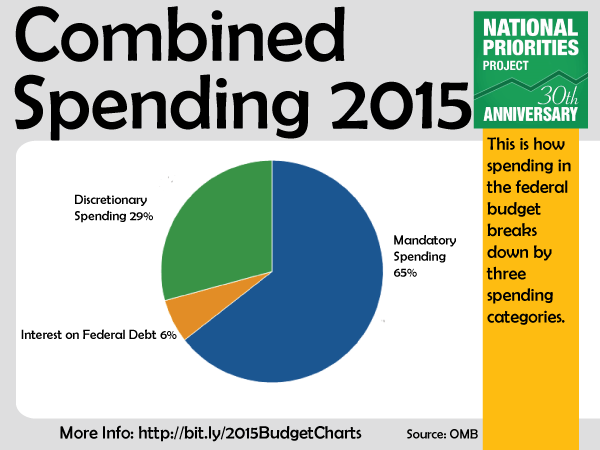
Mandatory and Discretionary Spending and Interest on Federal Debt
This is how discretionary spending, above, fits into the overall federal budget. As you can see, discretionary spending is less than a third of all federal spending. Sixty-five percent of spending, or $2.6 trillion, falls under the mandatory spending category. Mandatory spending refers to spending for earned-benefit programs like Medicare and Social Security. The remaining 6 percent of the federal budget, or $252 billion, will go towards interest on the federal debt.
Mandatory Spending
This chart shows how President Obama plans to spend $2.6 trillion in mandatory spending in fiscal year 2015. Mandatory spending includes programs like Social Security and Medicare, which are often called earned-benefit programs. Lawmakers do not choose the exact amount of money spent on these programs, because it depends on how many people qualify for benefits.
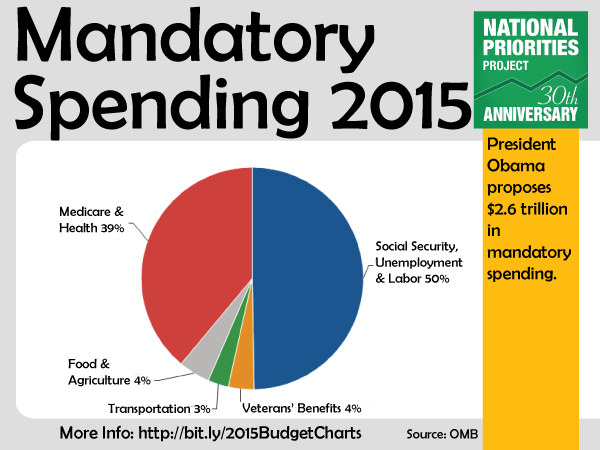
Note: While there is some mandatory spending that occurs in categories beyond the five that are shown in this chart, they are so small that together they account for less than 1 percent of the total and have been omitted.
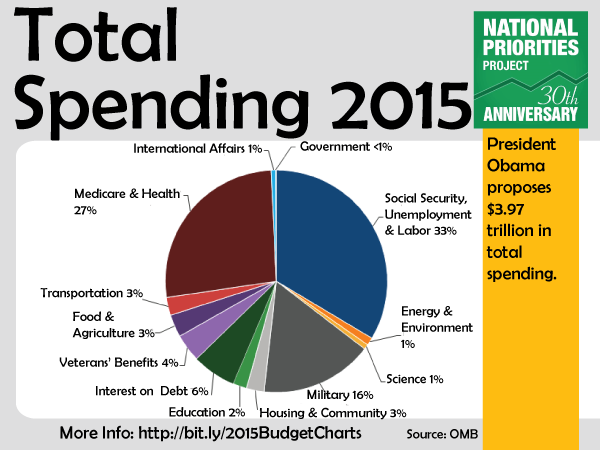
Total Spending
This chart shows how President Obama proposes allocating all $3.97 trillion in federal spending in fiscal year 2015. This includes every kind of federal spending, from funding for discretionary programs like job training and environmental protection to mandatory programs like Social Security and Medicare as well as interest payments on the federal debt.
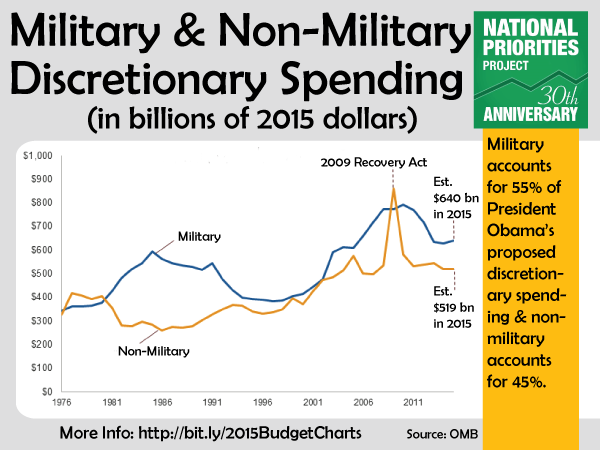
MIlitary and Non-Military Discretionary Spending
This chart shows how funding for military and non-military discretionary spending has changed over time. Military spending accounts for 55 percent of the president’s 2015 discretionary budget proposal, while non-military spending accounts for 45 percent.
Federal Spending and Revenue as a Share of GDP
This chart shows federal spending and tax revenue as a share of the overall U.S. economy all the way back to 1930. In 2015, President Obama proposes federal spending levels totaling 21 percent of the U.S. economy and tax revenue equal to 18 percent.

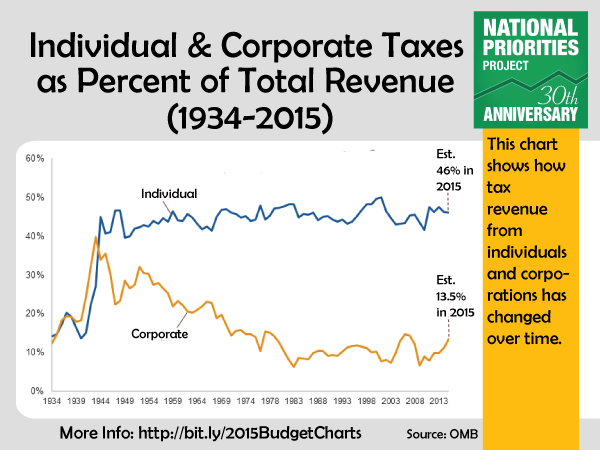
Individual and Corporate Income Taxes as Percent of Total Federal Revenue
This chart shows how tax revenue from individuals and corporations has changed over time. Individual income taxes will account for 46 percent of total tax revenue in 2015, while corporations will contribute 13.5 percent. Other federal revenue will come from payroll taxes, as well as customs and excise taxes.
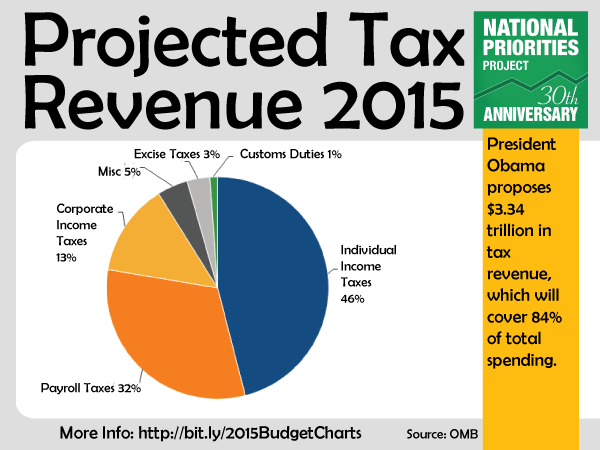
Total Tax Revenue
President Obama proposes collecting $3.34 trillion in total tax revenue in fiscal year 2015, with individual income taxes and payroll taxes – which fund Social Security and Medicare – as the largest revenue sources. Tax revenue will cover 84 percent of total spending. The rest – 16 percent – will come from borrowing.
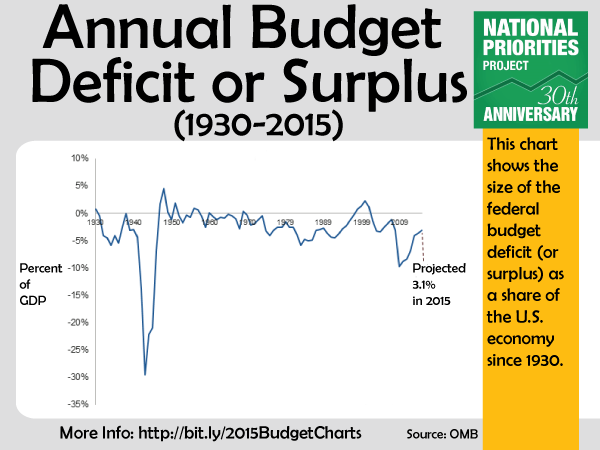
Annual Budget Deficit or Surplus as a Share of the Economy
This chart shows the size of the federal budget deficit (or surplus) as a share of the overall U.S. economy since 1930. In President Obama’s 2015 budget, the deficit amounts to 3.1 percent of the economy. As you can see, that’s roughly on par with annual deficits since World War II.
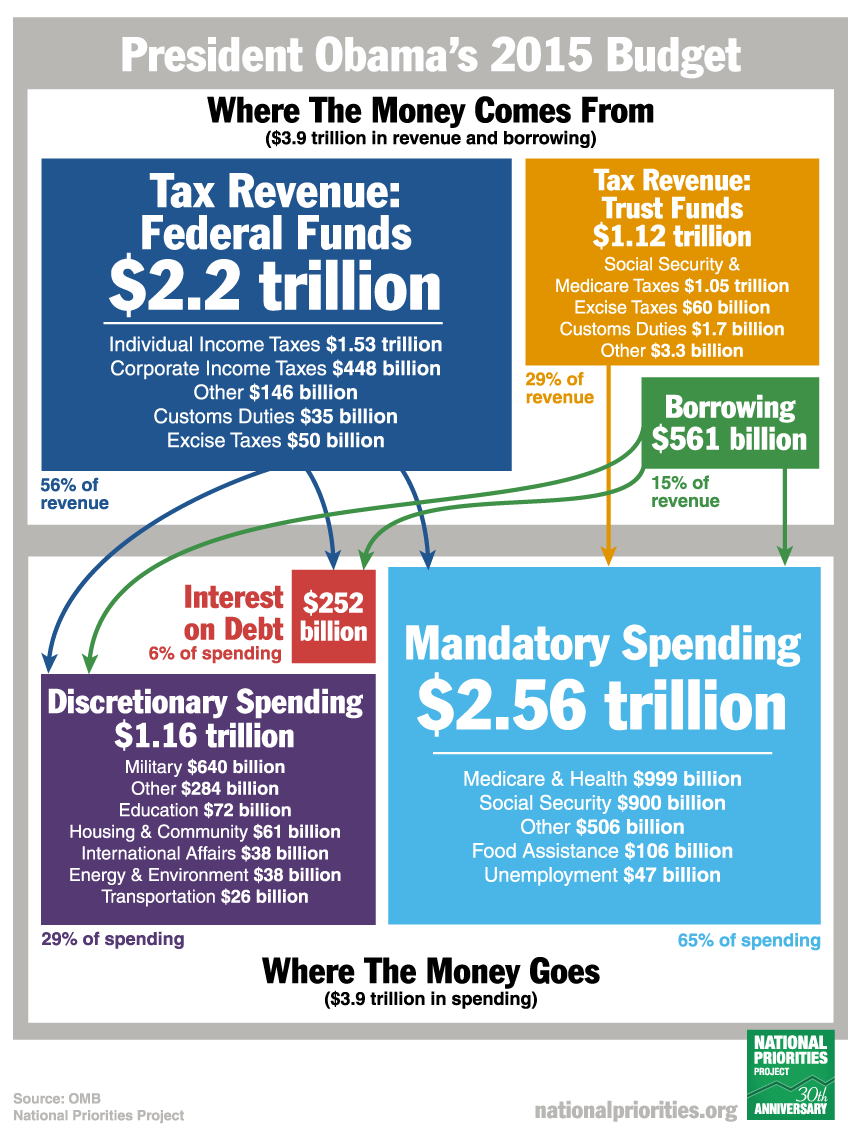
All Revenue and Spending: Where the Money Comes From and Where the Money Goes
This graphic shows how the government brings in revenue - from different types of taxes as well as borrowing - and how it spends money on programs ranging from Medicare to education to the military to interest on the federal debt.
For additional analysis of the President’s fiscal 2015 budget, see NPP’s President Obama Proposes 2015 Budget.