President’s 2016 Budget in Pictures
Feb. 9, 2015 - Download PDF Version
By Jasmine Tucker
Easily share any of the charts below by clicking on the social media buttons directly below them.
President Obama recently released his fiscal year 2016 budget proposal. Budgets are about our nation’s priorities: What are we going to spend money on? How are we going to raise the money we want to spend?
Though the budget ultimately enacted by Congress may look very different from the budget request released by the president, the president’s budget is important. It’s the president’s vision for the country in fiscal year 2016 and beyond, and it reflects input and spending requests from every federal agency.
These pictures tell the story of the priorities found in the president’s budget.
President's Proposed 2016 Budget: Total Spending
This chart shows how President Obama proposed allocating $4.1 trillion* in total federal spending in fiscal year 2016, an increase of more than 5 percent over the total 2015 spending level. This includes every type of federal spending, from funding for discretionary programs like infrastructure improvements and job training to mandatory spending programs like Social Security and Medicare, as well as interest payments on the federal debt. Social Security and labor, Medicare and health programs, and military spending will make up 76 percent of the total budget, leaving just 24 percent, or $957 billion of the $4.1 trillion total, to spend on all other programs.
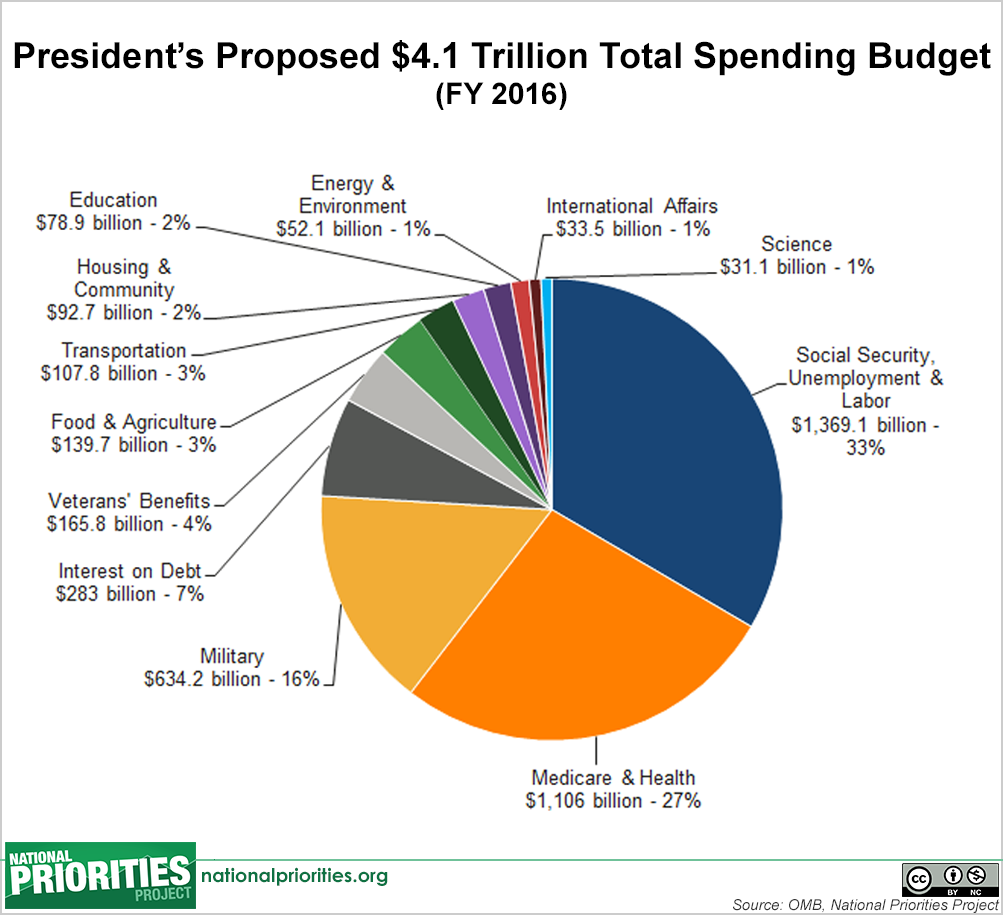
* Spending on Government (administration) is less than zero and omitted in the total spending pie chart. Lower than zero spending can occur when segments of government have surpluses from previous years that they return to the federal government.
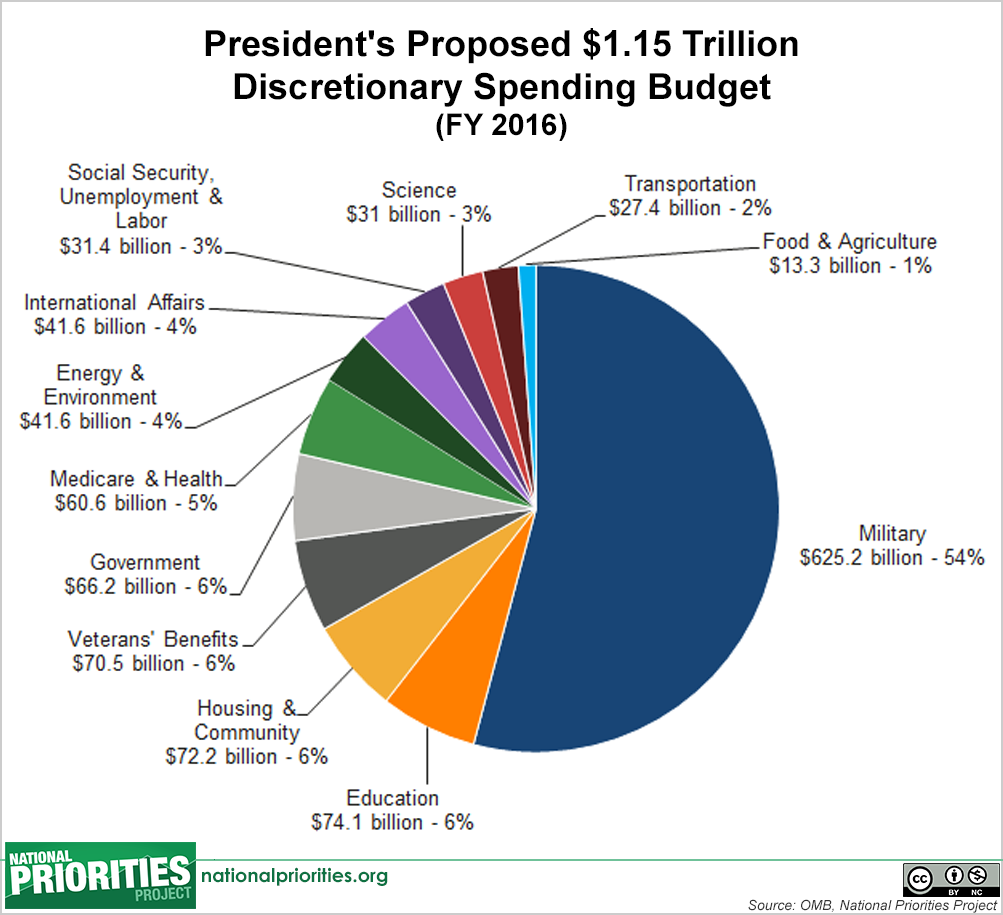
President's Proposed 2016 Budget: Discretionary Spending
President Obama proposes to spend $1.15 trillion in discretionary spending in fiscal year 2016, an increase of 2 percent over the 2015 enacted level. Discretionary spending is the portion of the federal budget that Congress determines annually in the appropriations process and accounts for 28 percent of all spending in the president’s proposed 2016 budget. It does not include earned benefits programs that people pay into like Social Security and Medicare. This chart shows how the president would allocate that spending.
President's Proposed 2016 Budget: Mandatory Spending
President Obama proposes to spend $2.63 trillionº in mandatory spending in fiscal year 2016, an increase of more than 5 percent over the 2015 enacted level. Mandatory spending includes earned-benefit programs that people pay into, such as Social Security and Medicare, and accounts for 65 percent of all spending in the president’s proposed 2016 budget. Lawmakers do not choose the exact amount of money spent on these programs, because they are dependent on the number of people who qualify for benefits, but rule changes can indirectly affect how much is spent. This chart shows how the president would allocate that spending.
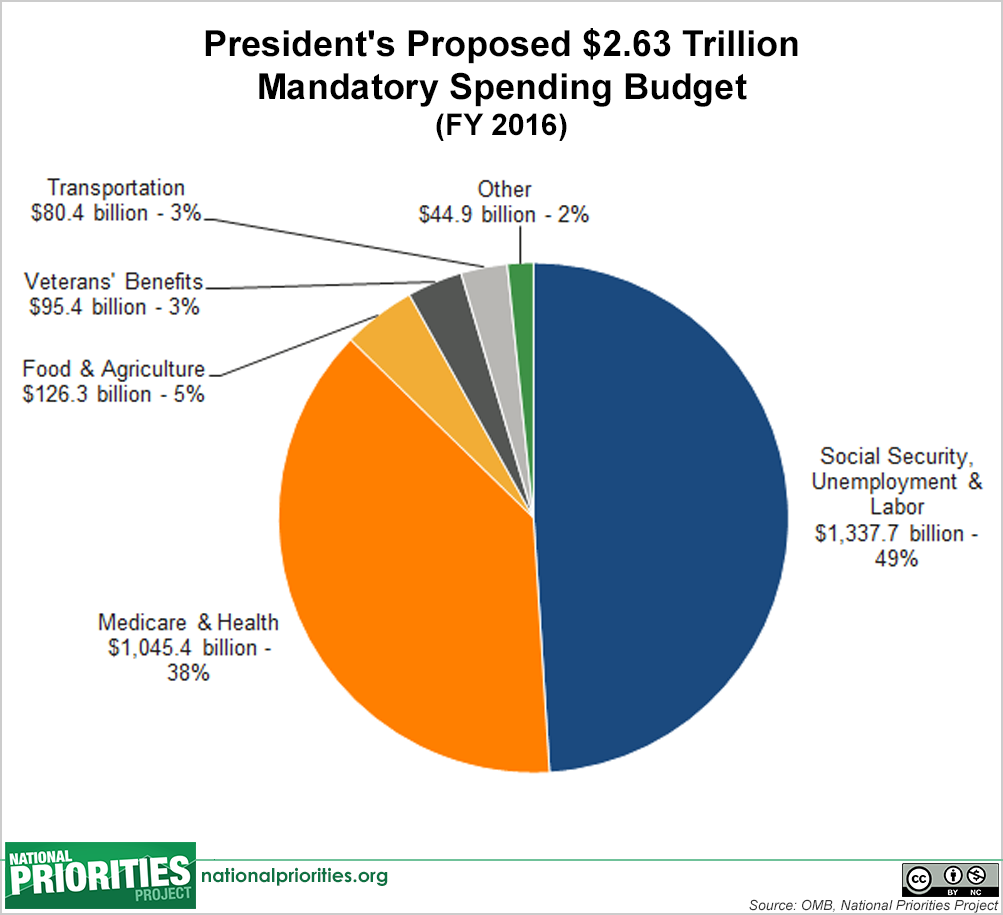
º Totals in chart do not equal $2.63 trillion because spending on Government (administration) and International Affairs are less than zero and are omitted in the mandatory spending pie chart. Lower than zero spending can occur when segments of government have surpluses from previous years that they return to the federal government. “Other” includes categories of spending that contributed less than 1 percent of mandatory spending each, including Energy & Environment, Military, Education, and Science.
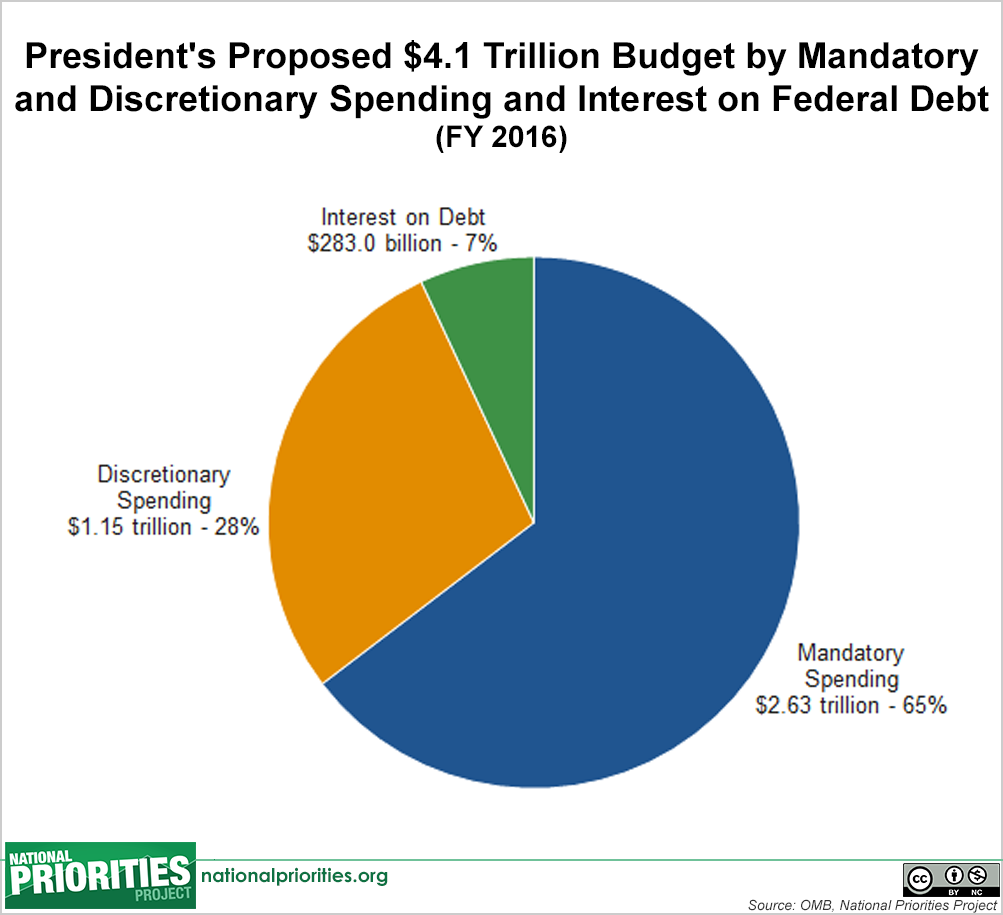
President's Proposed 2016 Budget: Mandatory and Discretionary Spending and Interest on Debt
This chart shows how mandatory spending and discretionary spending fit into the president’s overall budget. Under the president’s proposal, $1.15 trillion in discretionary spending would make up less than a third of all federal spending while 65 percent of spending, or $2.63 trillion, would be spent on mandatory spending programs. The remaining 7 percent of the budget, or $283 billion, would go towards interest on the federal debt.
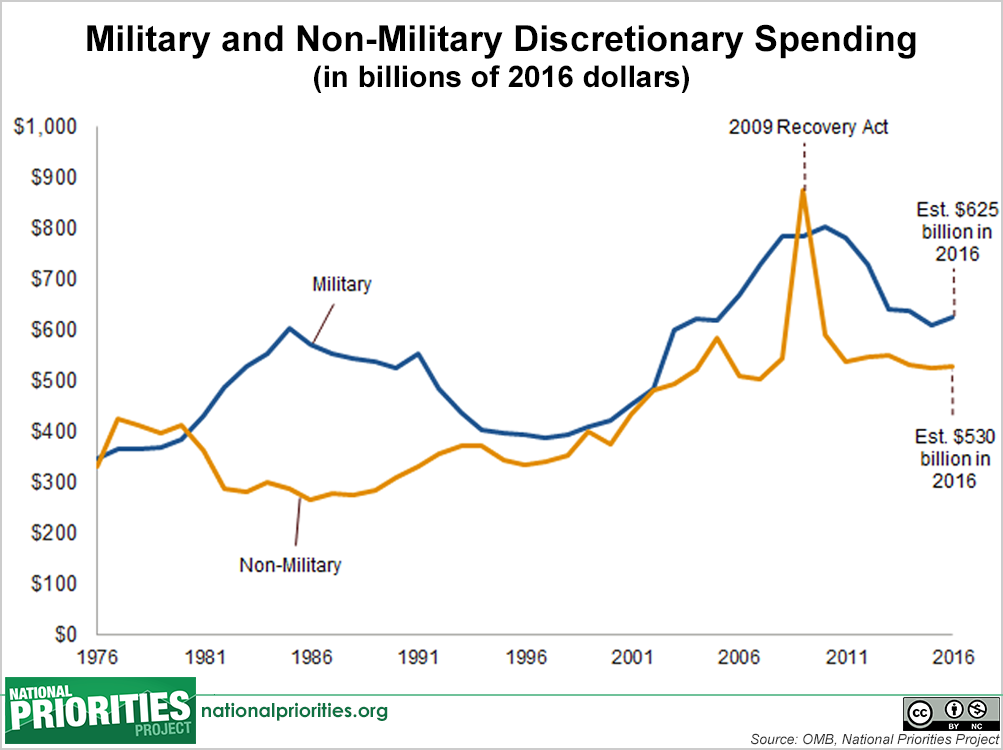
President's Proposed 2016 Budget: Military and Non-Military Discretionary Spending
This chart shows how funding for military and non-military discretionary programs has changed over time. Under the president’s fiscal year 2016 discretionary budget, military spending would account for 54 percent, while non-military spending would account for 46 percent.
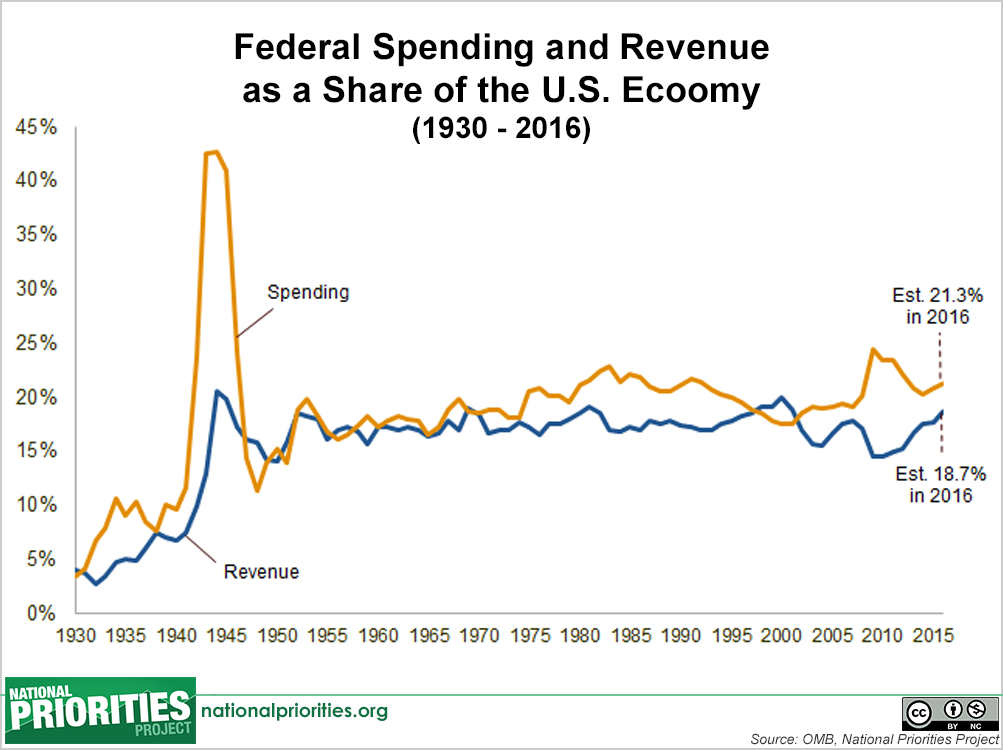
President's Proposed 2016 Budget: Federal Spending and Revenue as Share of U.S. Economy (GDP)
This chart shows federal spending and tax revenue as a share of the overall U.S. economy (measured by Gross Domestic Product, or GDP) dating back to 1930. In fiscal year 2016, the president’s budget proposes federal spending levels totaling 21.3 percent of the U.S. economy and revenues as 18.7 percent.
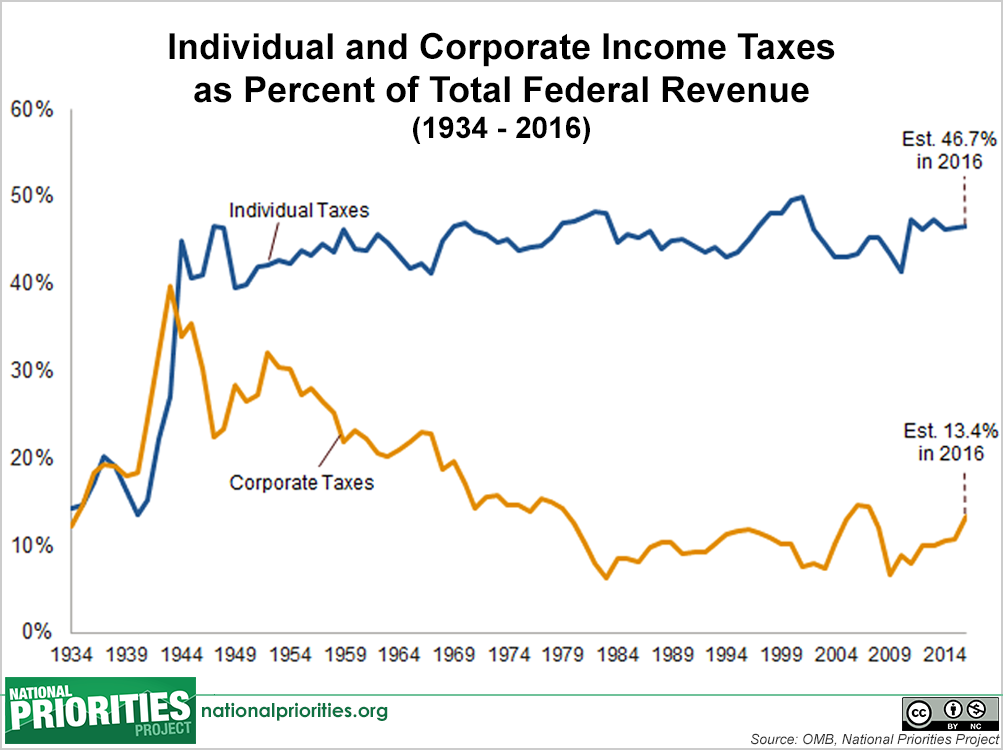
President's Proposed '16 Budget: Individual/Corporate Income Taxes as % of Total Federal Revenue
This chart shows how tax revenue from individual income taxes and corporate income taxes has changed over time. In fiscal year 2016, President Obama projects that individual income taxes will account for 46.7 percent of total tax revenue, while corporations will contribute 13.4 percent. The remaining 40 percent of federal revenue will come primarily from payroll taxes from Social Security and Medicare, as well as other sources such as customs and excise taxes.
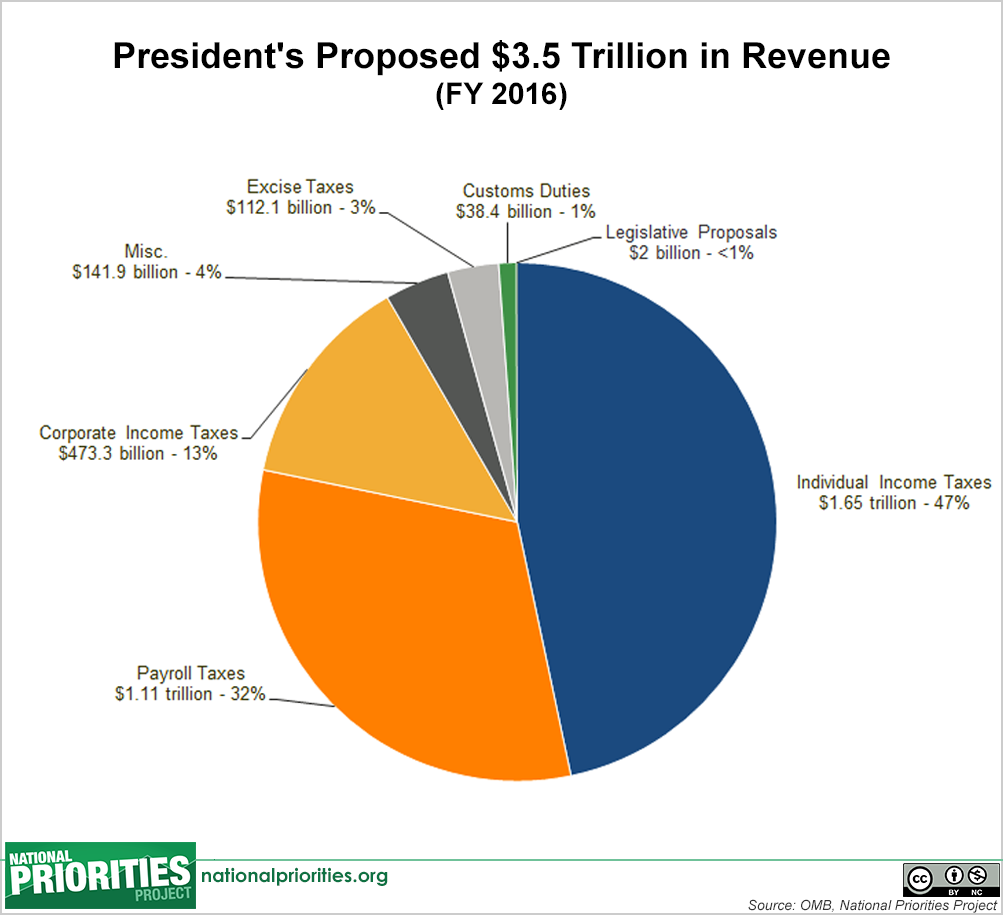
President's Proposed 2016 Budget: Total Tax Revenue
In 2016, the president proposes collecting $3.5 trillion in total tax revenue, with individual income taxes and payroll taxes – which fund Social Security and Medicare – as the largest source of revenues. President Obama proposes a budget where tax revenue will cover nearly 87 percent of total spending. The rest – 13 percent – will come from borrowing.
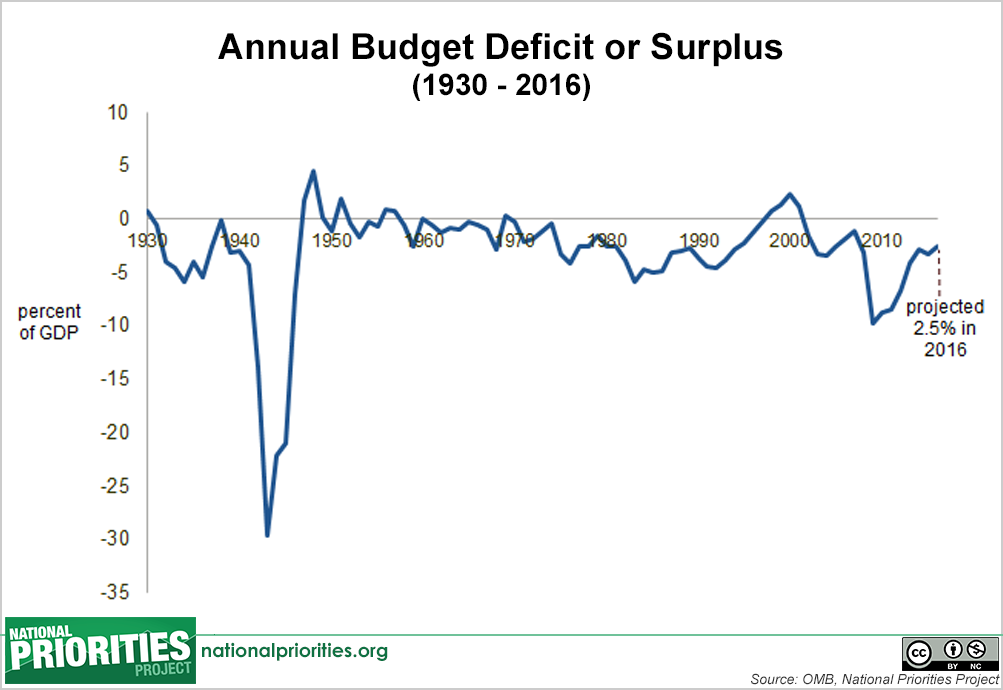
President's Proposed 2016 Budget: Annual Budget Deficit or Surplus as Share of the Economy (GDP)
This chart shows the size of the federal budget deficit (or surplus) as a share of the overall U.S. economy (measured by Gross Domestic Product, or GDP) dating back to 1930. In President Obama’s fiscal year 2016 budget, the deficit amounts to 2.5 percent of the economy. That’s on par with annual deficits since World War II.
For additional analysis of the President’s fiscal 2016 budget, see NPP’s President Obama Proposes 2016 Budget.