Data Wednesday: Table View
By
Becky Sweger
Posted:
|
Transparency & Data
This is the latest entry in NPP’s Data Wednesday series, intended to introduce new users to our Federal Priorities Database. All posts are archived here.
In the last few weeks, we’ve discussed how to search NPP’s Federal Priorities Database and how to interpret the data map. The map is useful because the colors allow you to quickly compare results between states. Sometimes, though, it’s more useful to see your results in a table, which displays data for all states and years in a single view.
It’s easy to switch from the map to a table. First, run a database search. By default, the results will appear on the map. From there, it’s just a matter of clicking the Table link, located above the map and to its right.
You should now see the search results in a table. Scroll down to see all regions, and scroll to the right to see the results for previous years. If you’re looking at a money-related dataset, you’ll have the option to adjust for inflation, just like you can on the map.
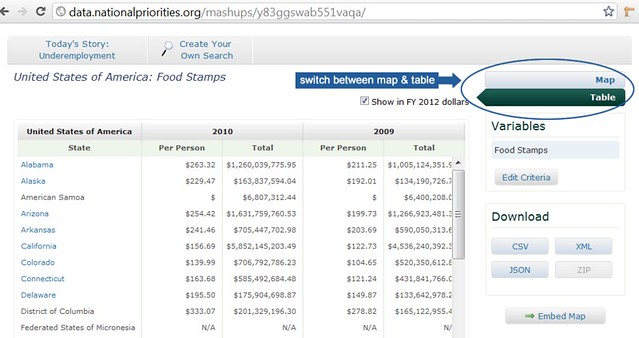
One final note: you will see some regions in the table that aren’t on the map, namely Puerto Rico and the U.S. outlying territories. If a dataset has numbers for these regions (not all of them do), they will show up here.