Tax Day 2022: We Got The Receipts
By
Ashik Siddique
Posted:
|
Taxes & Revenue
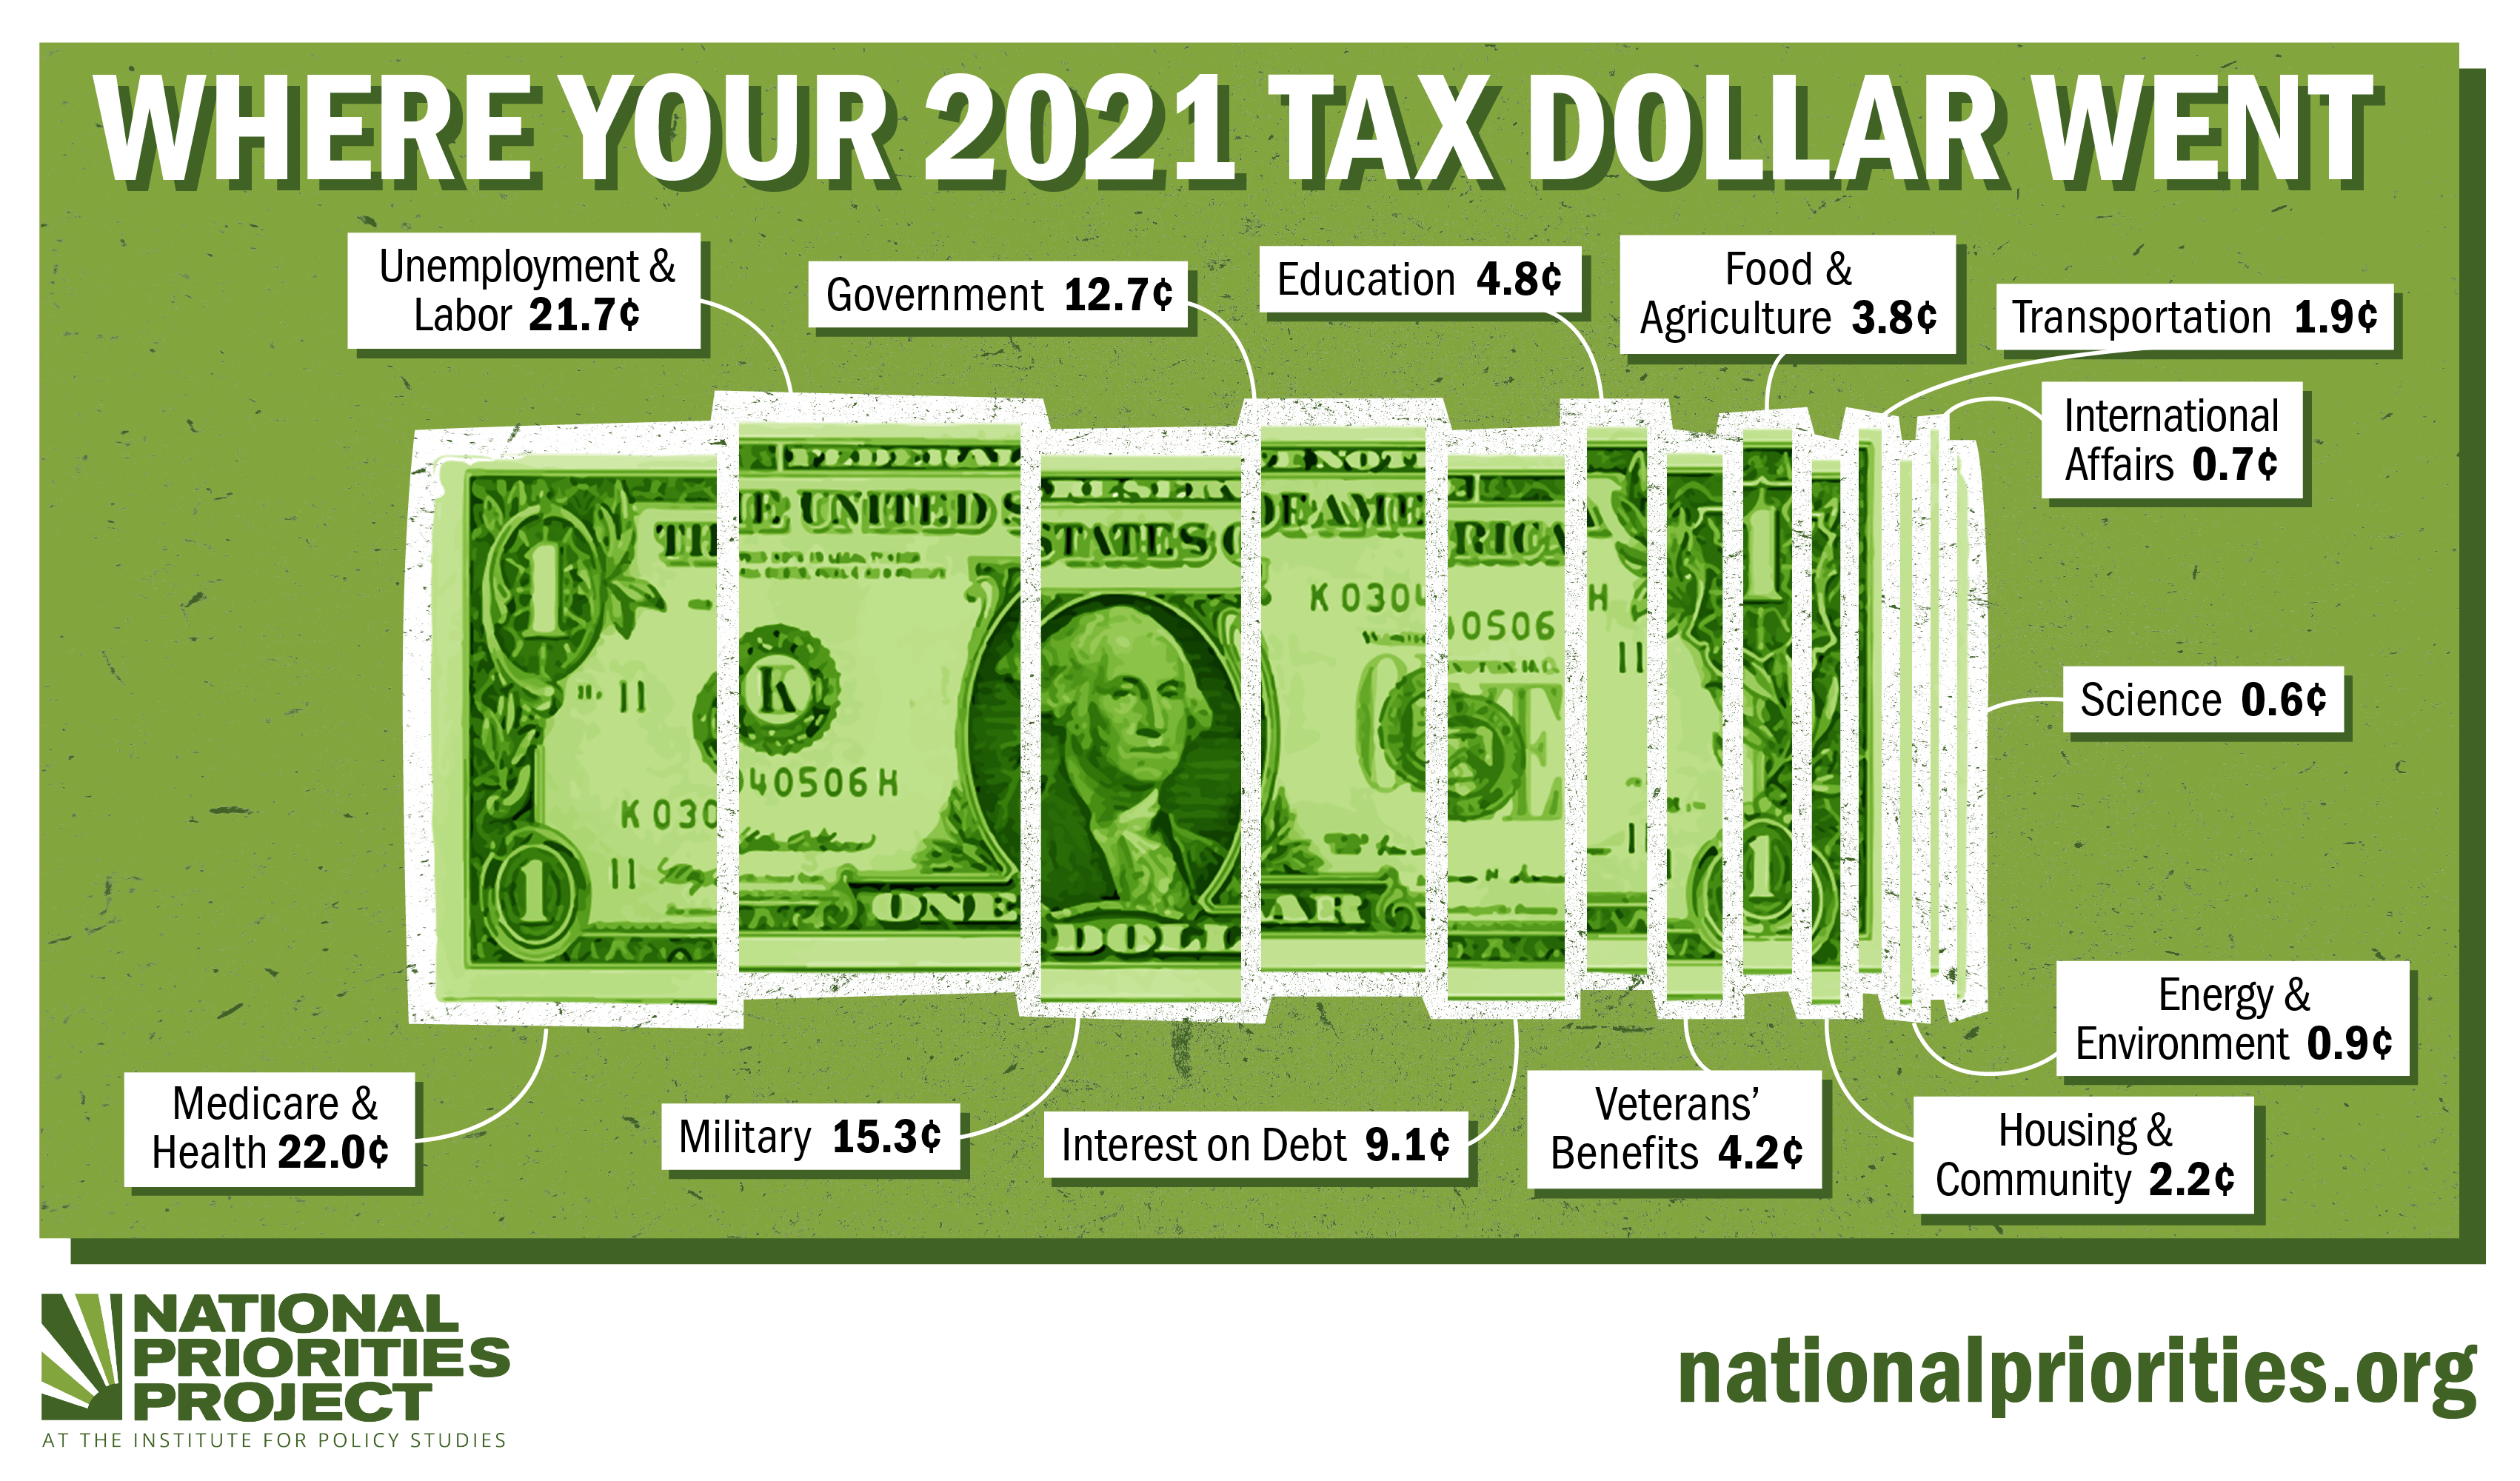
How does our government actually spend our tax dollars? Around Tax Day, it’s fair to wonder. Most of us never find out.
But NPP has the receipts. Our latest Tax Receipt analysis breaks down your federal income taxes by the portions of government spending you paid for.
In previous years, the military has typically been one of the largest categories of spending. Last year, more than usual went to health, unemployment, and labor as the largest categories of spending — a result of the COVID pandemic and ongoing economic crisis.
But a lot of your tax dollars still ended up in corporate pockets, padding the wallets of war profiteers. And militarized parts of the budget greatly outweigh significant items of social spending, which are still severely underfunded compared to the scale of ongoing societal crises.
Some Tax Day facts for 2022:
-
The average taxpayer contributed about $2,000 to the military in 2021. Almost half of that went to corporate military contractors.
-
The average taxpayer paid $929 just for Pentagon contractors in 2021, more than five times the amount the same taxpayer contributed to K-12 education, $171.
-
The average taxpayer paid $62 for nuclear weapons, and just $27 for the Centers for Disease Control & Prevention (CDC).
-
The average taxpayer paid $62 for deportations and border control, versus just $5 for renewable energy.
-
The average taxpayer paid $18 for federal prisons, and just $7 for anti-homelessness programs.
Does all that make you feel safe?
The United States is investing too much in the military and law enforcement, and not enough on urgently necessary priorities for everyday people.
But that’s not inevitable. Shifting just a fraction of what our government spends on militarization for real human needs could transform whole communities across this country.
Check out NPP’s Tax Receipt tool to see more about what your taxes pay for, and how much of your money goes to each:
-
Get your personalized tax receipt for the past year.
-
Don't like your tax receipt? Make your own federal spending choices.